
Carbon footprint
A single tool to give shape to your greenhouse gas emissions, from the wide view down to each individual site.
The situation
Your emissions come from many sources, in formats that do not talk to each other. The result sits in a spreadsheet nobody reads, and it says nothing about where to act.
What you get
Deliverables that are yours to keep and to show.
- Maps of your emissions, from the macro level down to the site, in 2D and in 3D
- Dynamic, interactive dashboards that need no training to read
- Your emission sources consolidated into a single reference
- Change over time analysed, so you can measure what your actions achieve
How we go about it
From your data sources to measurable change.
- 1
Consolidating the sources
We gather your emissions data whatever its format or origin, then tie it back to the territory.
- 2
AI change detection
We use artificial intelligence to detect and analyse change over time, across industry, agriculture, forestry and urban planning.
- 3
Satellite data
We process satellite imagery to compute and represent biomass, atmospheric flows and other quantities measurable from space.
A worked example
Two organisations, two scopes, one and the same skill.
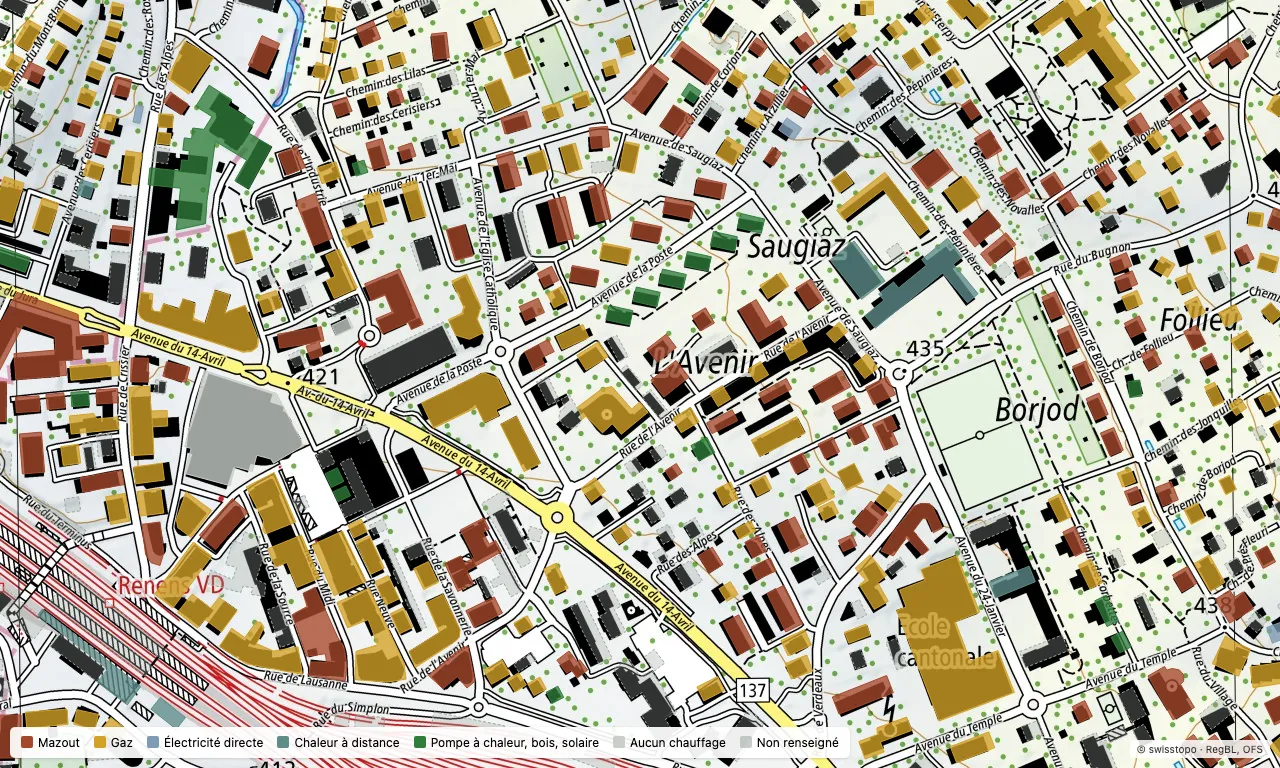
A municipality sees its emissions building by building
- The starting point
- A municipality of 10,000 prepares its climate plan. It knows the total emissions of its building stock, but not which of its 3,000 buildings weigh most, nor where to concentrate renovation support.
- What the map shows
- Each building coloured by its heating source, taken from the federal building register. In this district of Renens, 156 buildings run on gas and 121 on oil, against 18 on a heat pump, wood or solar: the priority is plain to see. And 143 buildings have no heating data in the register, close to a third of the district. They stay grey on the map: an honest map also shows what it does not know, and that gap is the first job.
- What it lets you decide
- Where to act first, how many buildings to target to meet a goal, and where to start collecting the missing data before renovation is even discussed.
An organisation measures its digital footprint
- The starting point
- Digital escapes the usual carbon accounting: workstations spread across sites, servers, cloud services whose hosting country is often unknown.
- What the map shows
- The estate tied to where it is used, the infrastructure hosting it located, and the footprint that follows from each country's electricity mix.
- What it lets you decide
- Extend equipment lifespan, change host, or weigh the two: each scenario is costed before it is committed.
Let's talk about your carbon footprint
One conversation is enough to see what mapping can bring to your approach. We answer directly, with no form to fill in.