Strategic analysis
Your challenges, resources and climate risks placed on the territory, then put to the test on a digital twin.
The situation
Strategic decisions commit years and heavy budgets. Taking them without seeing where resources, flows and risks concentrate is a gamble.
What you get
A solid basis for making the call.
- Your strategic challenges and resources mapped
- Your flows tied to risk indicators
- A digital twin to test scenarios without touching the real world
- Dynamic dashboards that track how your indicators evolve
How we go about it
From spatio-temporal data to a tested scenario.
- 1
Your data in time and space
We work with your spatio-temporal data, or build it with you where it does not exist yet.
- 2
Cross-analysis and risk indicators
We combine it with environmental and climate data, and tie your flows to risk indicators.
- 3
Scenarios on a digital twin
You test your scenarios on a digital replica: traffic and transport, logistics, urban planning, infrastructure, natural hazards, tourism.
A worked example
Two scales, the territory and the world.
Which infrastructure to protect first
- The starting point
- A cantonal department has a limited adaptation budget. It knows floods are possible; it does not know which of its facilities are genuinely exposed, nor which would become unreachable.
- What the map shows
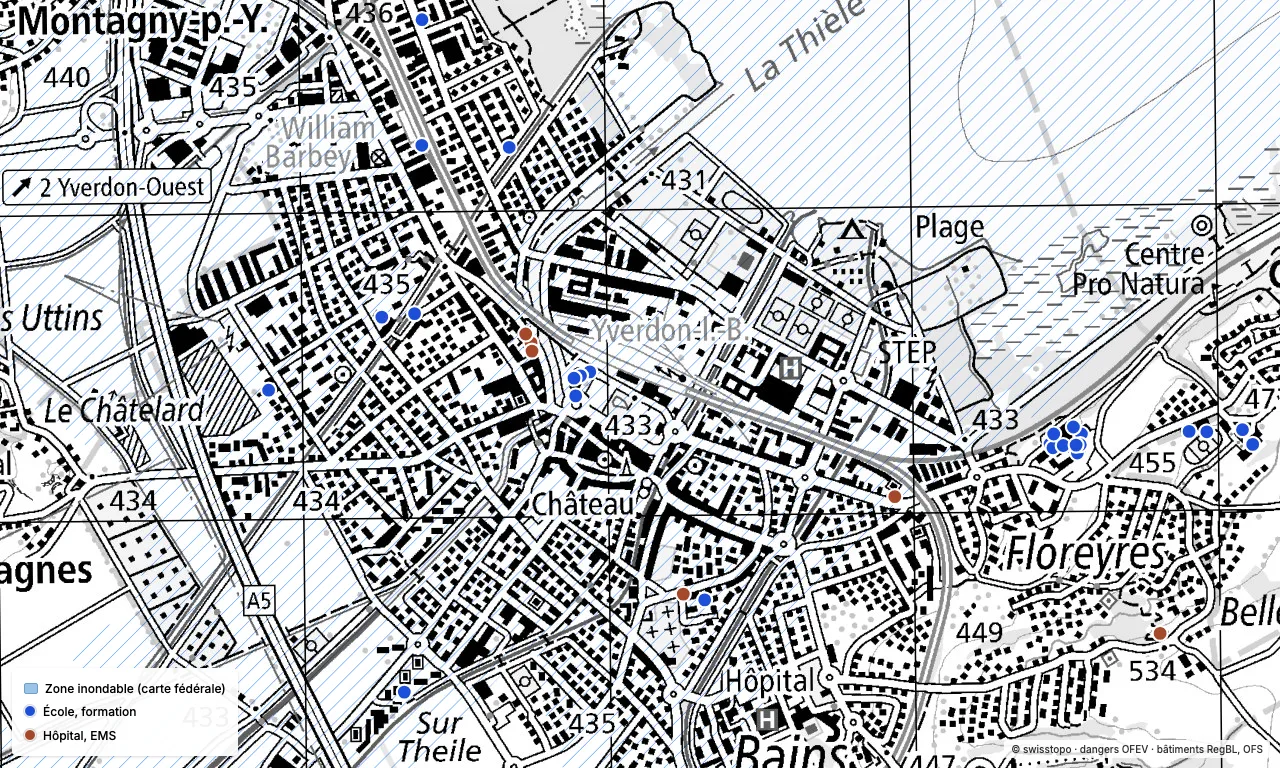
- The federal hundred-year flood map laid over the sensitive buildings in the register: here, around Yverdon-les-Bains, 26 schools and 6 care facilities. Those falling inside the flood extent stand out at a glance, as do the roads serving them.
- What it lets you decide
- Which buildings to reinforce first, how many people are affected, and which emergency routes stay usable if the flood comes.
Exposed plants, supply lines that can break
- The starting point
- A Swiss-headquartered group manufactures on three continents. Each site is monitored on its own, with its own risks: natural, industrial, social, technical or financial. But nobody knows what happens if a strait closes: which plants stop, after how many days, and where to reroute.
- What the map shows
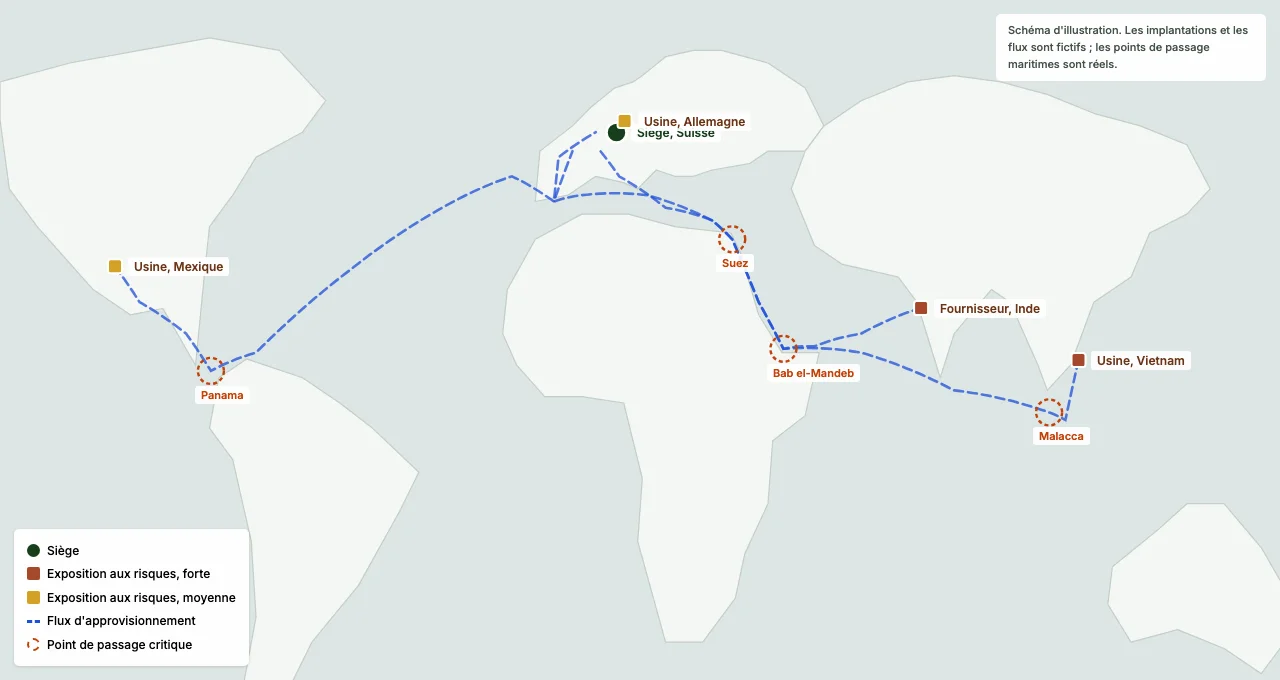
- The sites with their local exposure to risk, whatever its nature, and the supply corridors with their chokepoints: Suez, Malacca, Bab el-Mandeb, Panama. One strait often serves several flows: that is where the unnoticed dependency hides.
- What it lets you decide
- What buffer stock to hold and where, which alternative routes to prepare, and which suppliers to duplicate first. Every disruption scenario is tested on the digital twin before it happens for real.
Let's talk about your strategic challenges
One conversation is enough to see what mapping can bring to your approach. We answer directly, with no form to fill in.